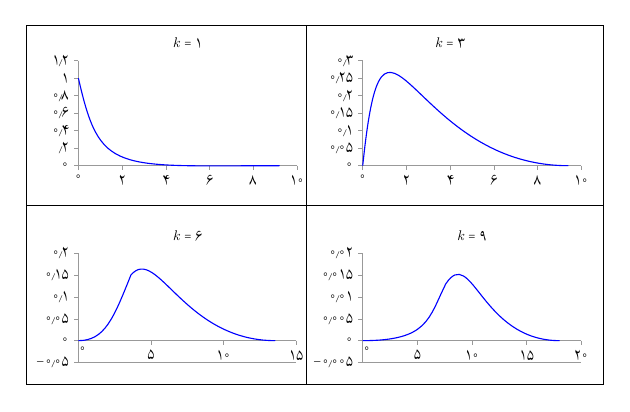
به نظر من روش نامناسبی برای رسم چند نمودار در کنار هم انتخاب کردهاید؛ اما راهحل به صورت زیر است.
ابتدا کتابخانه calc را در پیشدرامد (preamble) فراخوانی کنید:
\usetikzlibrary{calc}
سپس یک کادر مستطیلی دور کل شکلها رسم کنید و آن را به عنوان bounding box قرار دهید:
\draw[use as bounding box] (-.6,-2.5) rectangle (6,1.6);
حال میتوانید وسط اضلاع این مستطیل را به هم متصل نمایید:
\draw (current bounding box.east) -- (current bounding box.west);
\draw ($(current bounding box.north)+(-0.1,0)$) -- ($(current bounding box.south)+(-0.1,0)$);
کد کامل به صورت زیر خواهد بود:
\documentclass{report}

\usepackage{tikz, pgf, pgfplots, pgfkeys, MnSymbol}
\usetikzlibrary{arrows, automata, patterns, shapes}
\usetikzlibrary{positioning,arrows, decorations.markings}
\tikzstyle{midway3} = [postaction={decorate}, decoration={markings, mark=at position 0.3 with {\arrow{>}}}]
\tikzstyle{midway5} = [postaction={decorate}, decoration={markings, mark=at position 0.5 with {\arrow{>}}}]


\pgfplotsset{compat=1.15}
\usepgfplotslibrary{fillbetween}
\usetikzlibrary{calc}
\usepackage{xepersian}
\settextfont{Yas}
\setdigitfont{Yas}
\begin{document}

\begin{center}
	\begin{tikzpicture} [axis/.style={>=stealth'}, scale=2.2]%41
	\draw[use as bounding box] (-.6,-2.5) rectangle (6,1.6);
	\draw (current bounding box.east) -- (current bounding box.west);
	\draw ($(current bounding box.north)+(-0.1,0)$) -- ($(current bounding box.south)+(-0.1,0)$);

	\draw[axis, black!40](-.05,0)--(2.5,0);
	\draw[axis, black!40](0,-.05)--(0,1.2);

	\foreach \x/\xtext in {0/0, .5/2, 1/4, 1.5/6, 2/8, 2.5/10}
	\draw[shift={(\x,0)}, black!40] (0pt,0pt) -- (0pt,-1.5pt) node[below, black] {$\xtext$};

	\foreach \y/\ytext in {0/0, .2/.2, .4/0.4, .6/0.6, .8/0.8, 1/1, 1.2/1.2}
	\draw[shift={(0,\y)}, black!40] (0pt,0pt) -- (-1.5pt,0pt) node[left, black] {$\ytext$};


	\draw[line width=.8pt,blue](0,1).. controls (.25,-.1) and (.4,0)  ..(2.3,0);

	\fill(1.25,1.4)node{$k=1$};
	%%%%%%%%%%%%%%%%%%%%%%%%%%%%%%%%%%%%%%%%%%%%%%%%%%%%

	\draw[axis, black!40](3.2,0)--(5.75,0);
	\draw[axis, black!40](3.25,-.05)--(3.25,1.2);

	\foreach \x/\xtext in {3.25/0, 3.75/2, 4.25/4, 4.75/6, 5.25/8, 5.75/10}
	\draw[shift={(\x,0)}, black!40] (0pt,0pt) -- (0pt,-1.5pt) node[below, black] {$\xtext$};

	\foreach \y/\ytext in {0/0, .2/0.05, .4/0.1, .6/0.15, .8/0.2, 1/0.25, 1.2/0.3}
	\draw[shift={(3.25,\y)}, black!40] (0pt,0pt) -- (-1.5pt,0pt) node[left, black] {$\ytext$};


	\draw[line width=.8pt,blue](3.25,0).. controls (3.5,2.4) and (3.75,0)  ..(5.6,0);

	\fill(4.25,1.4)node{$k=3$};
	%%%%%%%%%%%%%%%%%%%%%%%%%%%%%%%%%%%%%%%%%%%%%%%%%%

	\draw[axis, black!40](-.05,-2.25)--(2.49,-2.25);
	\draw[axis, black!40](0,-1)--(0,-2.25);

	\foreach \x/\xtext in {.83/5, 1.66/10, 2.49/15}
	\draw[shift={(\x,-2)}, black!40] (0pt,0pt) -- (0pt,-1.5pt) node[below, black] {$\xtext$};

	\foreach \y/\ytext in {-2.25/-0.05, -2/0, -1.75/0.05,-1.5/0.1, -1.25/0.15, -1/0.2}
	\draw[shift={(0,\y)}, black!40] (0pt,0pt) -- (-1.5pt,0pt) node[left, black] {$\ytext$};

	\draw[black!40](0,-2)--(2.49,-2);


	\draw[line width=.8pt,blue](0,-2).. controls (.3,-2) and (.4,-1.75)  ..(.6,-1.25).. controls (.9,-.9) and (1.2,-2)  ..(2.25,-2);

	\fill(1.25,-.8)node{$k=6$};
	\fill(0.05,-2.1)node{$0$};
	%%%%%%%%%%%%%%%%%%%%%%%%%%%%%%%%%%%%%%%%%%%%%%%%%%%%%%

	\draw[axis, black!40](3.2,-2.25)--(5.75,-2.25);
	\draw[axis, black!40](3.25,-1)--(3.25,-2.25);

	\foreach \x/\xtext in {3.875/5, 4.5/10, 5.125/15, 5.75/20}
	\draw[shift={(\x,-2)}, black!40] (0pt,0pt) -- (0pt,-1.5pt) node[below, black] {$\xtext$};

	\foreach \y/\ytext in {-2.25/-0.005, -2/0, -1.75/0.005,-1.5/0.01, -1.25/0.015, -1/0.02}
	\draw[shift={(3.25,\y)}, black!40] (0pt,0pt) -- (-1.5pt,0pt) node[left, black] {$\ytext$};


	\draw[black!40](3.25,-2)--(5.75,-2);


	\draw[line width=.8pt,blue](3.25,-2).. controls (4,-2) and (4,-1.75)  ..(4.2,-1.35).. controls (4.5,-.9) and (4.6,-2)  ..(5.5,-2);

	\fill(4.5,-.8)node{$k=9$};
	\fill(3.3,-2.1)node{$0$};
	\end{tikzpicture}
\end{center}

\end{document}
نتیجه:
